I recently had the opportunity to attend a workshop at ESAD Valence. To my surprise, in their collection, they have original parts from one of Bertin’s reorderable matrix!
I had the opportunity to use the rebuilt matrix at VisWeek in Paris 2014. I’ve simulated the matrix using Excel macros and Excel conditional formats. Essentially the reorderable matrix is a physical visualization that takes a table of structured data and enables resorting of rows and columns based on data values to reveal clusters. Each block shows data on the top surface which represents a numeric value varying from the lowest value (full white) to the highest value (full black) and various textures inbetween. The user can then shuffle (i.e. reorder) full rows or full columns to regroup the data based on values so that clusters visually appear (Bertin called the process diagonalization, see the video). It’s a human-powered physical clustering algorithm.
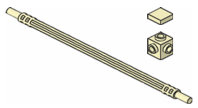
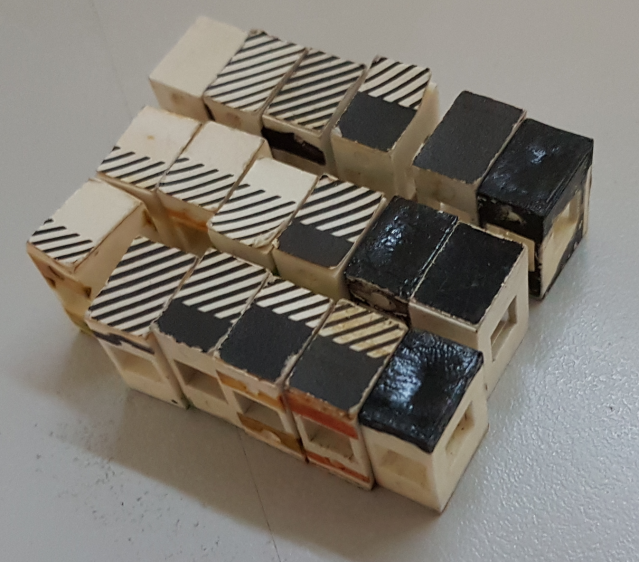
This particular version is made with tiny plastic blocks, about the size of Lego 1×1 bricks and sound the same as Lego when they jostle in the big bag of bricks (Bertin called them dominoes). I arranged a few on a desk into a matrix (the connecting rods weren’t available). You can see how patterns of all black, textured, and partially textured surfaces are highly visible:
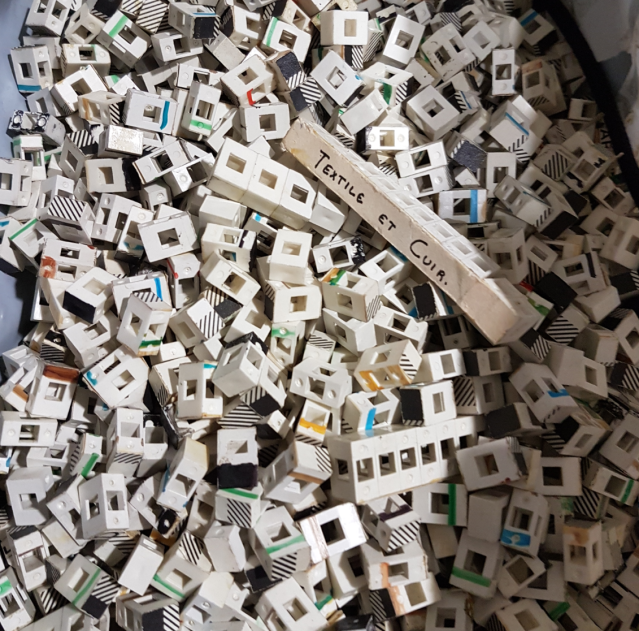
One really interesting aspect that I noticed is the colored edge stripe on some of the bricks, seen in the picture below (and quite noticeable in the bag where you can see some blocks have bright stripes in green, blue, yellow, orange, etc). I asked, but it was uncertain what their purpose was. The stripes are always on the sides where the rods go in; never the top. I’m guessing that it is some kind of recording system. Perhaps the user would draw a stripe across a row of bricks, maybe as a way to record the state. Since these colors were on the sides of the blocks, they wouldn’t be visible from above and therefore not interfere with patterns and clusters being created.
Another interesting aspect is that both the tops and bottoms of the blocks have the black-to-white texture patterns. We speculated that the blocks were reused from analysis to analysis, and it was easy to code both sides of the blocks. But, maybe there’s more. It would be feasible to re-order a matrix, take some kind of intervention, collect more data, then color the new state on the bottom of the blocks. Then a user could flip over the entire matrix, to see if the pattern had changed in some way. Again, speculation on my part.
The Lego-like aspect also suggests to me that a reorderable matrix could potentially be constructed out of standard Lego-blocks today: a 1×1 with holes on both sides, rods, and tiles in assorted shades of grey. And then concepts about data clustering could be taught in grade school.